 Beta
Beta
Forest carbon estimation
Carbon Critical × Aerolab · AGMARDT-funded R&D
Accurate carbon and biomass metrics for diverse forests, using consumer-grade drones, elevation data and machine learning algorithms to unlock new possibilities for small growers and indigenous forests.
Project summary
Forestry in Aotearoa removes 20-30 millions tonnes of carbon dioxide equivalent per year according to official reporting. Yet most measurement tooling still serves even-aged pine at prices that exclude the majority of forest owners. This initiative is about widening who can participate credibly in carbon markets, with a focus on native, mixed, regenerating and old-growth forests that tend to get overlooked.
- Low-cost hardware
- Native-forest priority
- Small-grower focus
- Rigorous validation
Forests and climate in Aotearoa
Official greenhouse gas indicators show sustained large removals from forestry over decades—but the politics and ecology of what we plant are contested.
Stats NZ's greenhouse gas indicators report annual removals in the order of 20-30 MtCO₂e from land use, land-use change, and forestry for each of the past three decades. That makes forestry one of the country's most important climate levers.
Why indigenous forest matters
Many New Zealanders want fewer pine monocultures and more indigenous cover. Native forests support biodiversity, cultural values, and long-lived carbon stocks. But they are also structurally complex, which makes consistent measurement harder than it is for monoculture conifer plantations.
NZ ETS and the measurement gap
The NZ ETS rewards planting and forest management, but credible carbon accounting needs defensible data. Native and mixed stands are harder to measure than pine, and incumbent solutions are often priced for large estates and exotic monocultures —leaving small growers under-served.
Voluntary carbon markets
A growing voluntary carbon market recognises the carbon and biodiversity benefits of native forests and channels committed funding toward them. Yet the market remains under-served by measurement solutions, and compliance costs are high—which limits who can credibly participate.
The barriers we targeted
Three structural facts encouraged us to develop a new approach for forests below the scale where enterprise LiDAR contracts make sense.
- Small forests dominate Roughly 85% of registered forests in New Zealand are small—under about 40 ha. That is a long tail of landowners who still need defensible numbers to be supported by policy and markets.
- MPI look-up tables NZ ETS participants with less than 100 ha of forest are subject to MPI tables that do not measure forest carbon directly and can fail to reward good stewardship outcomes.
- Enterprise limitations Native and regenerating stands vary in species mix, age, and structure. Traditional tools do not extend cleanly to “more natural” forests and LiDAR-centric workflows are too expensive for most small woodlots.
Partnership and field programme
Carbon Critical developed this work in collaboration with Aerolab, combining flight operations, photogrammetry, and machine learning. We worked with Tāne's Tree Trust to visit indigenous forests around the North Island, capturing imagery and ground truth data to enable our R&D work.
With AGMARDT funding, we completed the first development phase: a working prototype demonstrated on both exotic and native forests, with validation designed to support heterogeneous structure rather than only even-aged pine blocks.
Processing pipeline
The system is deliberately modular—so each stage can be improved, audited, and scaled toward a future commercial product.
-
1
Data gathering
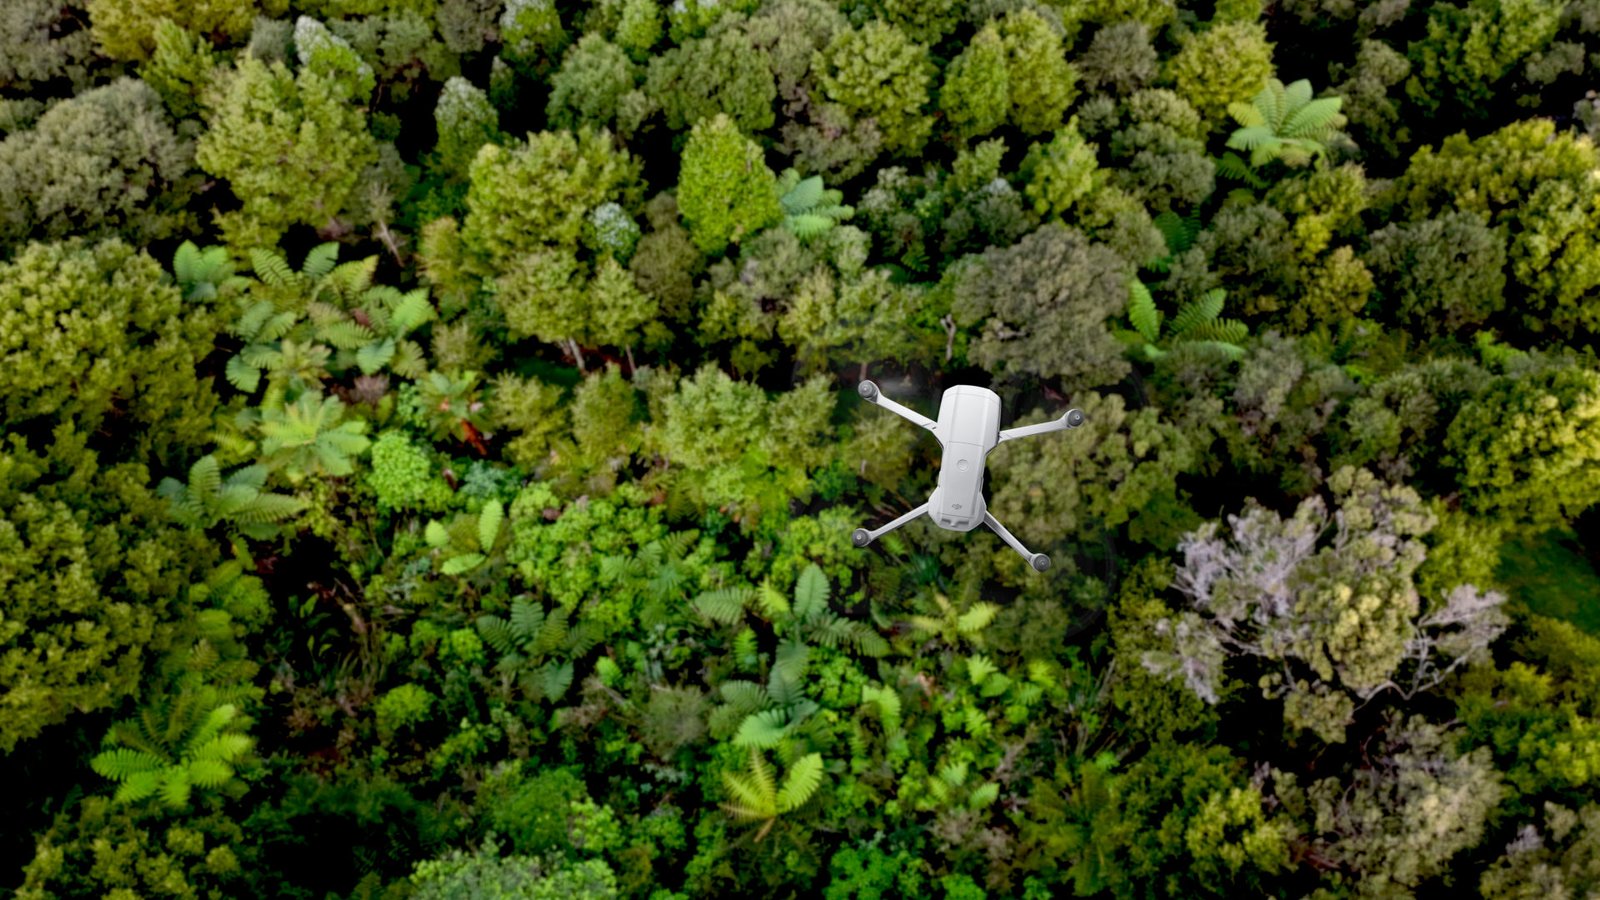
Programmed flights orbit each sampling location while the drone captures overlapping imagery of the canopy—using low-cost consumer drones (for example the DJI Mini class) rather than heavy LiDAR enabled airframes.
-
2
Data preparation
Corrections for calibration (GPS and altimeter errors), referencing against digital elevation models, then photogrammetry and dense stereo to derive geometric image representations that feed the learning stack.
-
3
Inference
A deep learning stage estimates forest carbon and other metrics of interest. The model is designed to integrate information across multiple species simultaneously without requiring an explicit species-classification front-end.
Why the technical path is different
Much of the industry still pushes toward expensive LiDAR and dense 3D point cloud reconstruction. We deliberately avoid full per-tree 3D reconstruction—which is where native complexity often breaks classical pipelines.
- Comparable accuracy, different economics Cross-validation yielded R² ≈ 0.77 for forest carbon (similar to LiDAR baselines) and R² ≈ 0.93 for mean tree height—while hardware is a fraction of the weight and cost of LiDAR rigs.
- Built for heterogeneity The approach is aimed especially at mixed, native, regenerating, and old-growth forests with complex structures that are often considered "too difficult / not worth it" by enterprise solutions.
- Public data in the loop Our solution integrates high resolution national LiDAR survey data and a bespoke position calibration process to overcome the accuracy limitations of conventional structure-from-motion approaches.
| Our prototype (consumer drone) | Typical LiDAR survey rig (indicative) | |
|---|---|---|
| Hardware cost | ~$1,300 | ~$65,000 |
| Flying weight | 249 g | ~7 kg |
| Forest carbon R² | 0.770 | 0.75 - 0.85 * |
| Mean height R² | 0.932 | — |
* Results are indicative only. R² values are not necessarily directly comparable between different systems and datasets.
Field campaign and results
We visited 128 sample plots across the North Island to build training and test data that reflects real terrain, species mix, and canopy texture.
- Imagery and reference measurements tied to diverse forest types—not a single plantation template
- Cross-validation R² ≈ 0.770 for forest carbon—competitive with LiDAR-class literature for comparable tasks
- Cross-validation R² ≈ 0.932 for mean tree height—strong structural signal from stereo geometry + learning
- End-to-end pipeline exercised on both exotic and indigenous sites to stress generalisation
- Explicit priority in project scope for indigenous and structurally complex forests
Outlook
A simple, reliable pathway to estimate carbon in indigenous forests can help de-risk native forestry for landowners and policy—so climate removals and ecological outcomes move together more often than they trade off.
We are now preparing the next phase: maturing the prototype into a commercial system with clearer product boundaries, operational playbooks for pilots, and continued validation with partners who manage the forests this work is meant to serve.
Get involved
If you manage native or mixed estates, fund forest climate solutions, or need better measurement economics at small scale—talk to us about trials, data partnerships, or deployment planning.